


In strategizing for a digitally-led economy, Saudi Arabia has been working to...
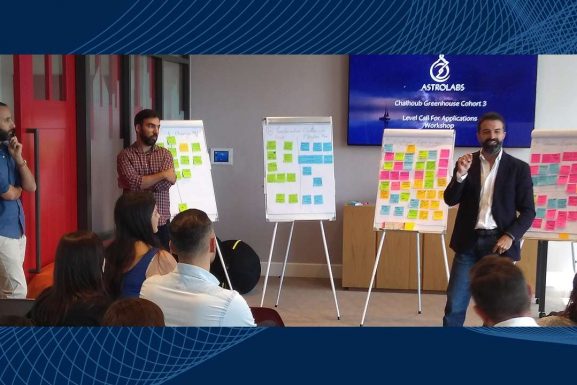
AstroLabs Insight


Ecosystem Highlights
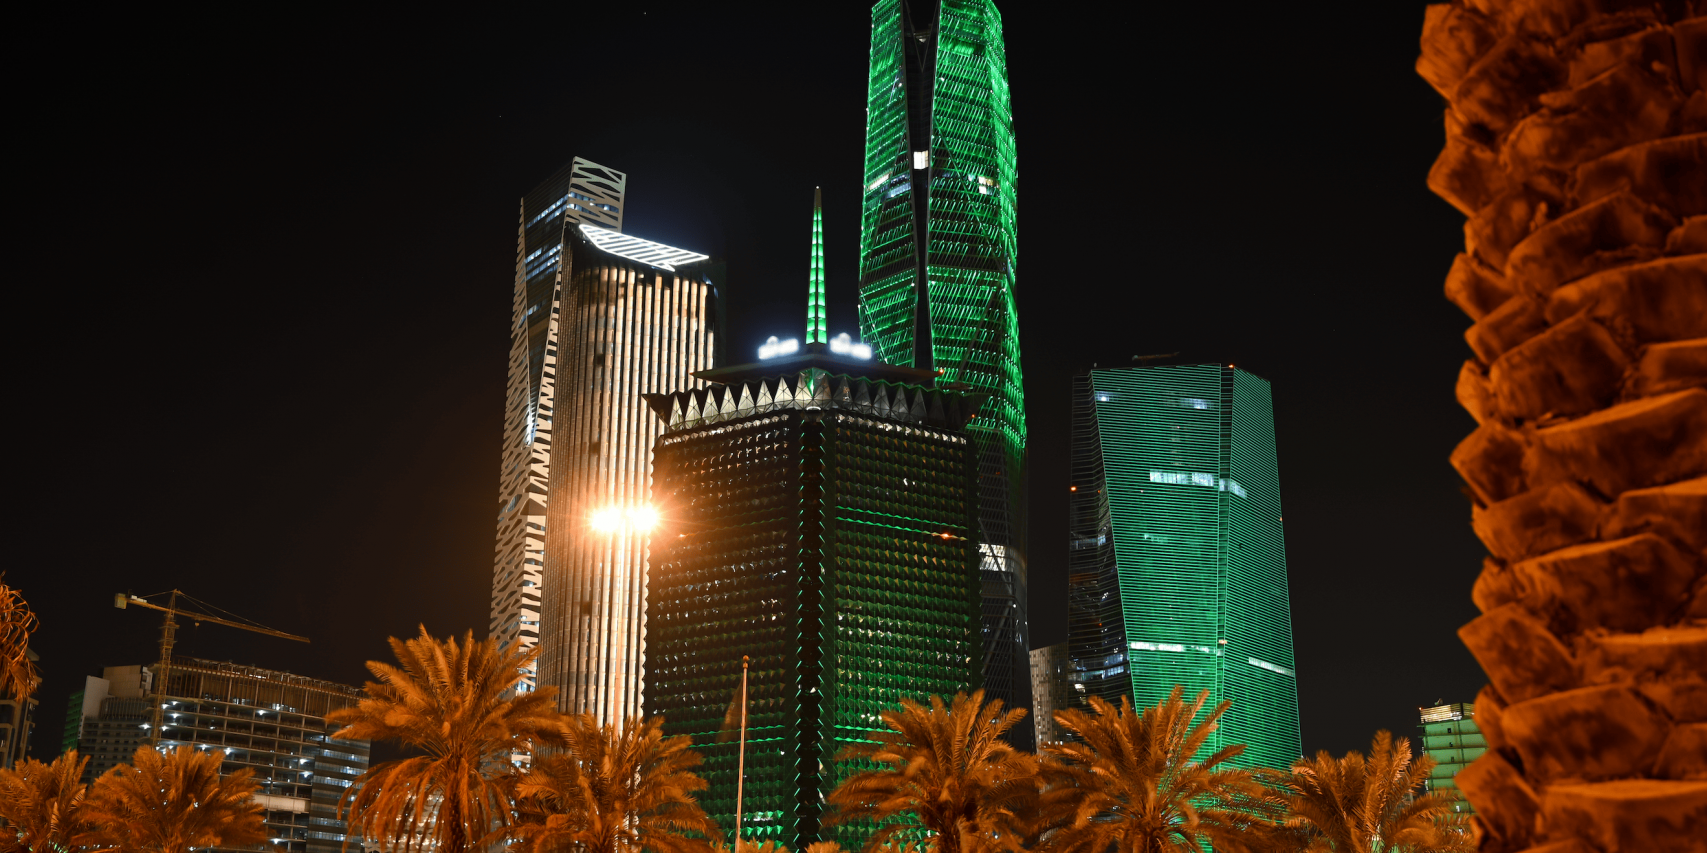
Saudi Arabia offers the largest consumer market in the Gulf region, with...
Worldwide, businesses may be facing an increasingly challenging operating environment. Companies are...
In the midst of a global shift to sustainable energy and a...
The Kingdom is increasingly viewed as a global go-to destination for businesses...

Subscribe to our
Ecosystem Monthly
Market Outlook
In strategizing for a digitally-led economy, Saudi Arabia has been working to...

Since the announcement of Vision 2030, the Saudi market has constantly remained...

There’s been a paradigm shift in the business landscape in Saudi Arabia,...
Saudi is ramping up to become a digital-first nation by the end...
Digital Transformation

From revenue generation and market entry to accelerating the growth of AI...

If visions set the pathway for the future, the attributes should have...

What happens when the future of gaming is translated into the future...
Contributed by: Roland Daher, AstroLabs CEO I vividly remember when Wamda coined...
Insight - your go-to market insider in MENA
What to Watch
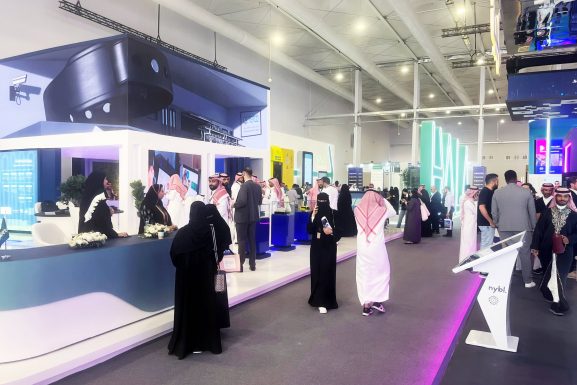
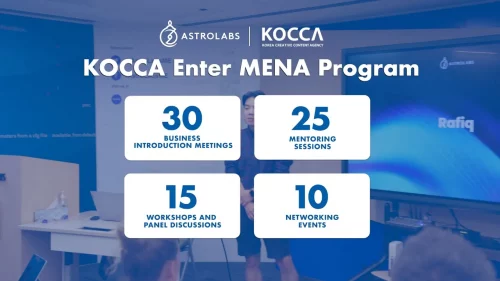
AstroLabs partnered with the Ministry of Communications and Information Technology in Saudi...

The astrolabe was an essential tool that was perfected by the Arabs...
The astrolabe was an essential tool that was perfected by the Arabs...
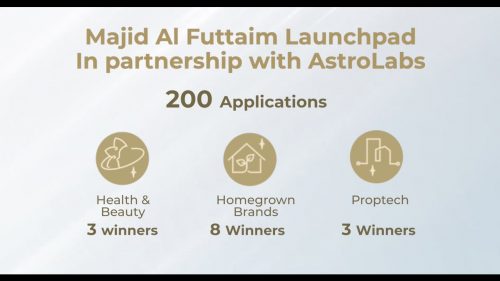
Tune in to our conversation with Majid Al Futtaim’s Joe Abi Akl,...
DMCC opened its spacious Parkside area in Jumeirah Lakes Towers, against the...